The article explains how to track revenue from automation emails and campaigns, giving insights into the effectiveness of marketing efforts.
Revenue Insights
Discover how your automation emails and campaigns contribute to your store's revenue with the Marketing Revenue report.

Uncover the revenue details that matter:
What's Included
All revenue sources are tracked, including BigCommerce, Shopify, Square, WooCommerce, Magento, and third-party deep data e-commerce integrations.
Discounts Consideration
For Shopify users, discounts in orders attributed to campaigns are excluded from the reported revenue, whereas WooCommerce and BigCommerce users will see discounts included in the revenue amount.
Calculating Revenue
To ensure accurate revenue tracking for purchases in connected e-commerce stores, specific conditions must be met:
-
Purchases must occur within 7 days of an automation email or campaign being sent.
-
Purchases must be made by contacts who received and engaged with your email before making a purchase.
-
Purchases must take place in a connected e-commerce store.
Navigating the Marketing Revenue Report
Access and explore the report effortlessly:
Accessing the Report
-
Click on "Reports" in the left menu.
-
Select "Marketing Revenue."
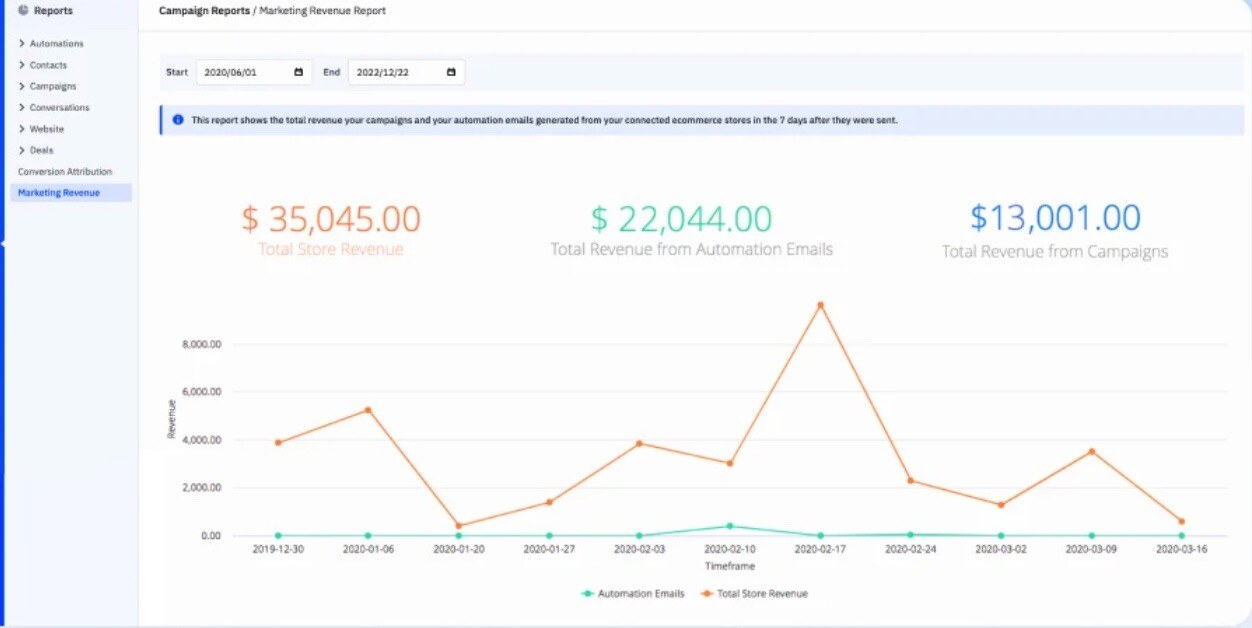
The report will load, displaying total revenue generated by automation emails and campaigns in the last 7 days.
Date Range Selection
Choose a specific date range by clicking on either the start or end date field and selecting a date from the calendar.
Currency Customization
If multiple currencies are involved, use the currency dropdown to select one. Note that the totals won't convert between currencies.
Revenue Totals

Check the top row for aggregate data within the chosen date range:
-
Total Store Revenue: Revenue from all connected stores during the date range.
-
Automation Email Revenue: Revenue generated by automation emails during the date range.
-
Campaign Revenue: Revenue generated by campaigns during the date range.
Revenue Line Graphs

Review revenue trends over time:
-
Automation Emails (Green): Hover over points to view revenue generated by automation emails at specific intervals.
-
Campaigns (Blue): Hover over points to view revenue generated by campaigns at specific intervals.
-
Store Revenue (Orange): Hover over points to view revenue generated by connected stores at specific intervals.
Top Performers
Identify the top 5 automation emails and campaigns based on revenue generated during the specified date range:
-
Top Automation Emails: The X-axis represents revenue, and the Y-axis displays automation email names. Hover over bars for details.
-
Top Campaigns: The X-axis represents revenue, and the Y-axis displays campaign names. Hover over bars for details.
Exporting Data
Download specific graph data:
-
Click the three-dot icon at the top right of each graph.
-
Select "Download Data" to export the graph's data as a CSV file.

