This article provides insights into form performance, including metrics like submissions, top forms, trends, filtering and export options.
The Form Performance report offers a comprehensive overview of form performance, allowing you to assess individual forms and their collective impact. This report empowers you to track form metrics, discover which forms are most effective, and analyze submission trends.
This feature is available on Pathfinder and Alpha Pro plans.

Key Features
With this report, you can:
-
Set a Custom Date Range: Analyze metrics within a specific timeframe.
-
Identify Top-Performing Forms: Quickly determine which forms generate the most contacts.
-
Export Data: Export form submission details in various formats, including CSV, TXT, Excel, JSON, HTML, or Markdown files.
Accessing the Form Performance Report
To access the Form Performance report, follow these methods:
-
Via the Reports Menu:
2. Via the Website Menu:
-
Click "Website" in the left menu.
-
Choose "Form Performance."
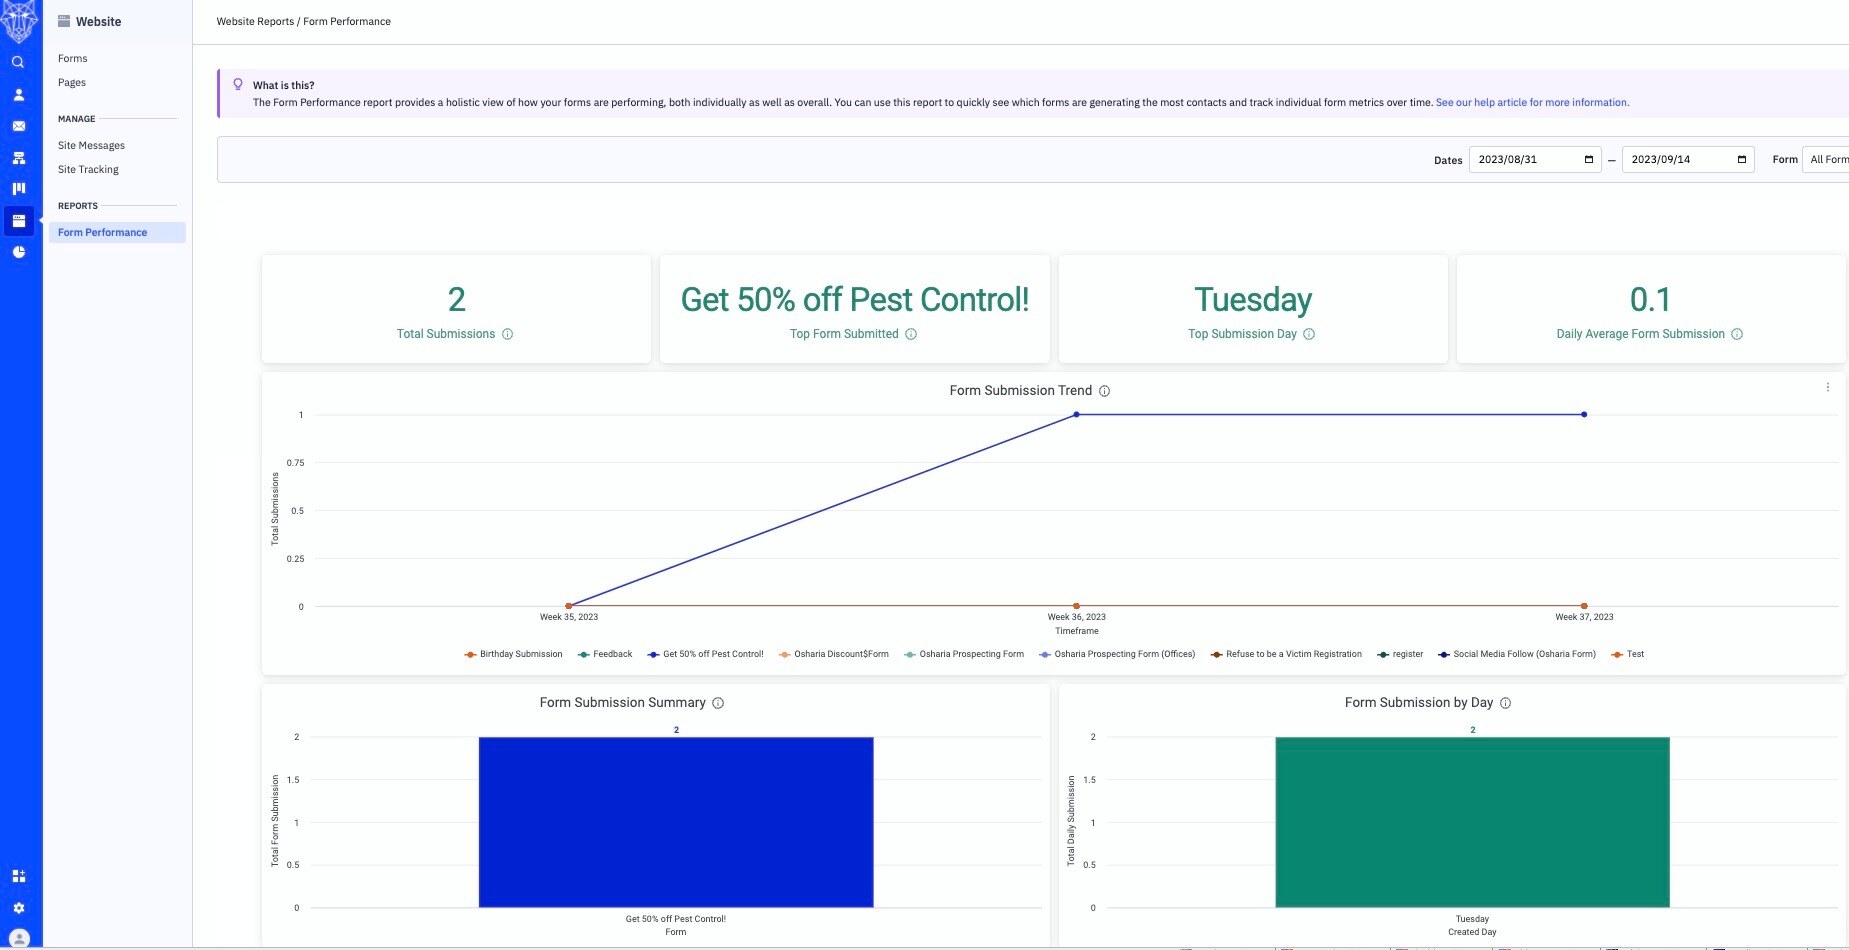
Upon access, the report will display performance metrics for all forms from the last 14 days by default.
Data Filtering in the Form Performance Report
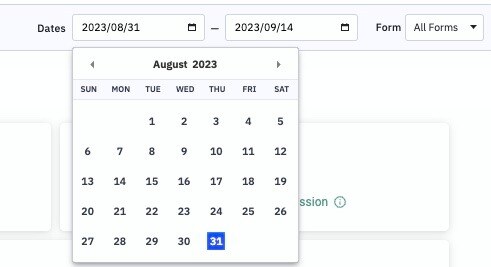
You can customize your data view using the date range filters at the top of the report. To set a date range, click on either the start or end date field and select a date from the pop-up calendar.

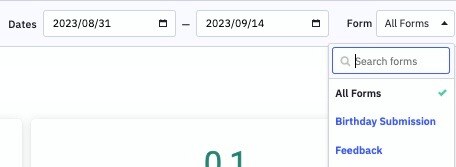
Additionally, you can filter data by a specific form using the "Form" dropdown. Please note that you can only select one form at a time. After setting your filters, the report page will reload to display form submission data based on your chosen parameters.

Information Included in the Form Performance Report
Form Performance Stats

At the top of the report, four key statistics offer quick insights into form submissions within your selected parameters:
-
Total Submissions: The overall number of form submissions.
-
Top Form Submitted: The form with the highest submission count.
-
Top Submission Day: The day of the week with the most form submissions.
-
Average Form Submissions: The daily average of form submissions.
Form Submission Trend Graph

This graph illustrates the total submissions for each form within your specified time range. Hover over data points to view submission counts for specific days.
Form Submission Summary Chart

The Form Submission Summary chart provides a quick overview of the total submissions for each form within the date range you set. This helps identify which forms receive the most submissions and which ones may require improvement.
Form Submission by Day Chart

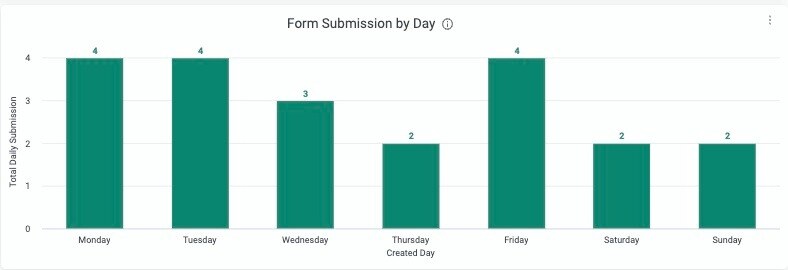
This chart displays the days with form submissions within your chosen time range. It enables you to identify peak submission days and those with lower performance.
Form Submission Details Table

The Form Submission Details table offers a granular breakdown of submission data, showing each submission's date, contact details, and the associated form. This information is valuable for investigating contact growth and identifying the forms through which contacts were acquired.
-
Form: Name of the form.
-
Submit Date: Date of form submission.
-
Contact First Name: First name of the submitting contact.
-
Contact Last Name: Last name of the submitting contact.
-
Contact Email: Email address submitted through the form.
You can sort this table alphabetically or in reverse alphabetical order by clicking on any column header.
Exporting the Form Submission Details Table
To share this data with your team or stakeholders, you can export the Form Submission Details table:
-
Hover over the Form Submission Details row to reveal three vertical dots on the right.
-
Click the dots and select "Download Data."
-
In the modal popup, choose your preferred file format (CSV, TXT, Excel, JSON, HTML, or Markdown).
-
Click "Download" to save the table to your computer.


